Application Log Monitoring Set Up using Grafana Loki and Promtail
blogs, tech-posts · Author: Nidhi BaldiaOur deployment involves two distinct servers: one housing Grafana Loki, and the other hosting a Dockerized application with Promtail installed.
Architecture:

Installing Grafana
- Setting up the prerequisites
- sudo apt-get install -y apt-transport-https - sudo apt-get install -y software-properties-common wget - wget -q -O - https://packages.grafana.com/gpg.key | sudo apt-key add - - Adding the repository to grafana
- echo "deb https://packages.grafana.com/oss/deb stable main" | sudo tee -a /etc/apt/sources.list.d/grafana.list - sudo apt-get update - Installing grafana
sudo apt-get install grafana - Verify the installation
grafana-server -version - Access the Loki http://
:3000
Installing Grafana Loki
-
Update and Upgrade System Packages sudo apt-get update
sudo apt-get upgrade -
Create Keyring Directory and Add Grafana GPG Key mkdir -p /etc/apt/keyrings/
wget -q -O - https://apt.grafana.com/gpg.key | gpg --dearmor > /etc/apt/keyrings/grafana.gpg -
Add Grafana Repository
echo "deb [signed-by=/etc/apt/keyrings/grafana.gpg] https://apt.grafana.com stable main" | tee /etc/apt/sources.list.d/grafana.list -
Install Loki
sudo apt-get install loki -
Create Loki systemd Service cd /etc/systemd/system/
sudo nano loki.service
Copy and paste the following into the loki.service file:
[Unit]
Description=Loki service After=network.target
[Service]
Type=simple
User=loki
ExecStart=/usr/bin/loki -config.file /etc/loki/config.yml
Give a reasonable amount of time for the server to start up/shut down TimeoutSec=120 Restart=on-failure
RestartSec=2
[Install] WantedBy=multi-user.target
-
Configure Loki**
sudo nano /etc/loki/config.yml
Copy and paste the following configuration into the config.yml file: auth_enabled: false
server:
http\_listen\_port: 3100
ingester:
lifecycler:
address: 127.0.0.1
ring:
kvstore:
store: inmemory replication\_factor: 1 final\_sleep: 0s
chunk\_idle\_period: 5m chunk\_retain\_period: 30s max\_transfer\_retries: 0
schema\_config:
configs:
   - from: 2018-04-15 store: boltdb object\_store: filesystem schema: v11
index:
prefix: index\_
period: 168h
storage\_config:
boltdb:
directory: /tmp/loki/index
filesystem:
directory: /tmp/loki/chunks
limits\_config:
enforce\_metric\_name: false reject\_old\_samples: true reject\_old\_samples\_max\_age: 168h
chunk\_store\_config:
max\_look\_back\_period: 0s
table\_manager:
retention\_deletes\_enabled: false retention\_period: 0s
- Start Loki Service sudo systemctl start loki
Installing Promtail on an EC2 Ubuntu Instance
Follow these precise steps to seamlessly install Promtail on an EC2 Ubuntu instance:
- Establish SSH Connection to Your EC2 Instance:
- Utilise an SSH client to connect securely to your designated Ubuntu instance on AWS EC2.
Download the Promtail Binary:
Obtain the binary via the following wget command:
wget https://github.com/grafana/loki/releases/download/v2.8.2/promtail-linux-amd64.zip Extract the Binary:
-
Unzip the downloaded file:
unzip promtail-linux-amd64.zip
-
Move the Binary to a Suitable Location:
- Place the Promtail binary in an appropriate directory: sudo mv promtail-linux-amd64 /usr/local/bin/promtail
- Establish a directory and configuration file for Promtail: sudo mkdir -p /etc/promtail
- Create a Configuration File for Promtail: sudo nano /etc/promtail/promtail.yaml
- Populate the configuration file (promtail.yaml) with the necessary parameters: server:
http\_listen\_port: 9080
clients:
   url: http://localhost:3100/loki/api/v1/push**
scrape\_configs:
   job\_name: system static\_configs:
      targets:
         localhost
-
Configure Promtail as a Service:
Develop a systemd service file for Promtail: sudo vim /etc/systemd/system/promtail.service
Insert the following content into the service file:
[Unit]
Description=Promtail service After=network.target
[Service]
User=root
ExecStart=/usr/local/bin/promtail -config.file=/etc/promtail/promtail.yaml
[Install] WantedBy=multi-user.target
-
Start and Enable Promtail:
Initiate the Promtail service and set it to launch automatically during boot:
sudo systemctl start promtail sudo systemctl enable promtail
-
Verify the Status:
Confirm the operational status of Promtail: sudo systemctl status promtail
-
Configure Firewall (if necessary):
If a firewall is active, permit inbound traffic on port 9080
Dashboard:
- Access grafana at http://
:3000 - Go to that address and login with the username “admin” and password “admin”
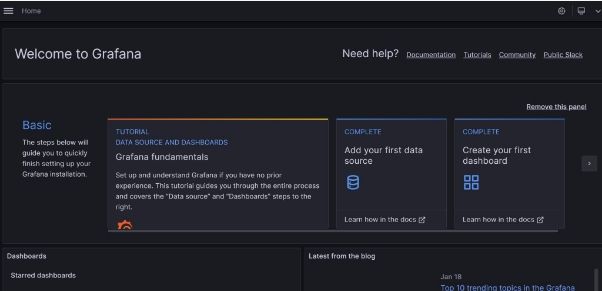
- And you’ll see this

- Click on “Add data source” and search for Loki and Click on it.
- Enter the Name as “Loki” (or whatever)and URL as “http://
:3100” (because that’s the address at which our loki server is running)
Visualizations:
Edit the promtail-config.yml file:
scrape\_configs:
- job\_name: docker-logs
static\_configs:
- targets:
  - localhost
labels:
job: my-container
host: localhost
path: /var/lib/docker/containers/container\_id/container\_id.log
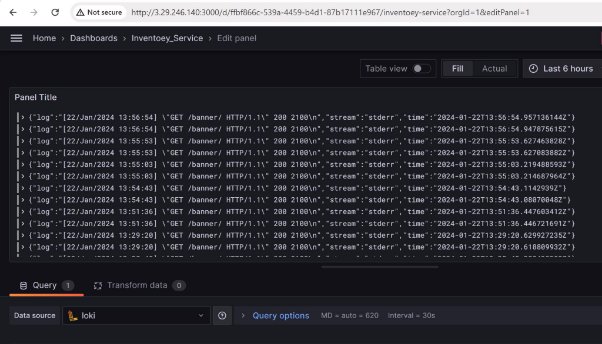
- Click on this button (top-right) to create a new panel in the same dashboard and then, click on “Add New Panel”
-
Add
{job=”my-container”, host=”localhost”}
- Here, the {job=”my-container”} is fetching all the logs of the container.
- Edit the panel title and apply it.
